


Type in a Cypher query, hit <enter>, then watch a graph visualization unfold. Want some data? Switch to the table view and download as CSV. Neo4j’s new Browser interface is a fluid developer experience, with iterative query authoring and graph visualization.
Available today in Neo4j 2.0.0 Milestone 6, download now to try out this shiny new user interface.
 Cypher Authoring

Neo4j Browser is like a mashup of a
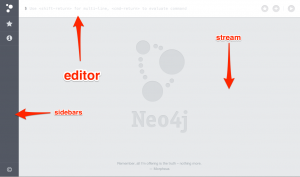
REPL and a lightweight IDE, sprinkled with pretty graphs (ooh, ahh). Writing and running Cypher queries is the center of all the action, which happens in the editor along the top. Just type in a single-line query and hit <enter>. You’ll get a result frame in the stream, showing either a table of property data or a graph visualization of nodes and relationships.
Type another query, get another frame. Tap the up arrow to retrieve a previous entry, edit, then run it again.
For larger queries, hit <shift-enter> to switch into multi-line editor mode. Now you’ll need to use <ctrl-enter> to run, and <ctrl> up or down arrow to navigate history (the modifier also works in single-line mode).
Finally, and thankfully, you can save scripts. Hit the star button to save the current editor content, which will be available in the sidebar. By convention, the first line can be a comment which will be used as the name of the query. You can even drag-and-drop in scripts, for sharing queries or small-scale data import.
Query result visualization
To show your proud parents (or maybe boss) the work you’ve been doing, nothing beats graph visualization to explain what’s going on. All exploration starts with a Cypher query that returns nodes or relationships.
Click on any node or relationship in the visualization to bring up an inspector which will reveal its properties. Switch to the inspector’s styling tab to tweak the colors and content, based on node label or relationship type.

Developer’s Friend
A primary design goal of Neo4j Browser is that every interaction is a demonstration. It should be capable enough to get things done, while recognizing that your main interest is developing an application. Any “buttons” which do anything work by running queries or commands which you can learn from.
 All the actions in the sidebar works like that, using client-side commands to run queries, interact with the REST api, or load content like help pages and mini guides. The interface should do things for you, but also show you how things are done so you can smoothly transition into application development.
Result frames adopt that perspective by being both meaningful and useful: examine the result data, then click a button to download raw JSON results or a CSV table.
We’ve got plans for extending this approach to make this a tool which integrates with your everyday workflows, whether debugging, prototyping, or exploring. Got some ideas of your own? Let us know how you use Neo4j on a daily basis.
Your turn
Neo4j Browser debuted at the recent Graph Connect in San Francisco, with a live preview during the keynote. You can get it today.
- Ask questions on Stack Overflow
- Discuss ideas on our Google Group
Thanks to everyone who helped beta-test the new interface.
Cheers,
Andreas


